Chinese Population in Canada and the US: Census Data by City
As of October 2026, official counts put about 1.7 million Chinese people in Canada (4.7% of the population, 2021 Census) and 5.83 million people of Chinese origin, excluding Taiwanese, in the United States (2024 American Community Survey). Nearly 70% of Chinese Canadians live in the Toronto and Vancouver metro areas, and 3.73 million Americans aged 5 and over speak Chinese at home. Origin counts and language counts overlap and cannot be added together.
Key takeaways
- Statistics Canada counted about 1.7 million Chinese people in 2021, 4.7% of the population; 39.6% of them live in the Toronto metro area and 29.9% in the Vancouver metro area.
- In Canada, 987,300 people can speak Mandarin and 724,925 can speak Cantonese; 730,125 have Mandarin as a mother tongue and 530,945 speak it most often at home.
- The US Census Bureau counted 5,828,538 people of Chinese origin (except Taiwanese) in 2024, and 3,734,956 people aged 5 and over who speak Chinese at home, about 1.6 million of them in the New York, Los Angeles and San Francisco metro areas.
- Origin and language counts largely overlap, so adding them counts people twice; 41% of Chinese Americans aged 5 and over speak Chinese at home.
- Language data from Canada’s 2026 Census is scheduled for September 8, 2027, and ethnocultural data for October 27, 2027.
How many Chinese people live in Canada and the US?
Canada had about 1.7 million Chinese people at its 2021 Census, and the United States had 5.83 million people of Chinese origin in 2024.
- Canada: Chinese populations numbered 1.7 million in 2021, 4.7% of the total population, more than double the 1996 count.1 Statistics Canada counts them through the “Chinese” category of the visible minority variable, which takes in people who reported “Chinese” alone or “Chinese” and “White”.1
- United States: the 2024 American Community Survey (ACS) 1-year estimates put “Chinese, except Taiwanese”, alone or in any combination, at 5,828,538, with a margin of error of ±61,371; Taiwanese are a separate group of 380,382.2 The Census Bureau rounds this to 5.8 million and names it the largest Asian group, ahead of Asian Indian (5.6 million) and Filipino (5.0 million).3
The two countries count on different cycles. Canada runs a census every five years, and the 2026 Census will release language data on September 8, 2027 and ethnocultural data on October 27, 2027.4 The US ACS is updated every year. Unless noted, the Canadian figures below are from the 2021 Census and the US figures from the 2024 ACS.
| Measure | Canada (2021 Census) | United States (2024 ACS) |
|---|---|---|
| Origin | About 1.7 million Chinese, 4.7% of the population | 5,828,538 Chinese (except Taiwanese) |
| Language | 1,528,860 can speak a Chinese language; 955,685 speak one most often at home | 3,734,956 aged 5+ speak Chinese at home |
| Next update | September 2027 (language), October 2027 (origin) | Every year |
The Canadian language counts come from tables 98-10-0217-01 and 98-10-0200-01,5,6 the US language count from table C16001.7 To check the numbers yourself or break them down further, by age or by municipality, go to the original tables:
- Chinese Canadians by city: Statistics Canada, “Portrait of the Chinese populations in Canada” (2026-02-13, catalogue 89-657-X2026001)1
- Languages in Canada: tables 98-10-0217-01 (knowledge),5 98-10-0181-01 (mother tongue)8 and 98-10-0200-01 (home language)6
- Origin and language in the US: ACS tables B02018 (detailed Asian groups)2 and C16001 (language spoken at home, aged 5+)7
Where do Chinese Canadians live?
Nearly 70% of Chinese Canadians live in two metro areas: 39.6% in the Toronto census metropolitan area (CMA) and 29.9% in the Vancouver CMA, together 69.5%, leaving 30.5% elsewhere.1
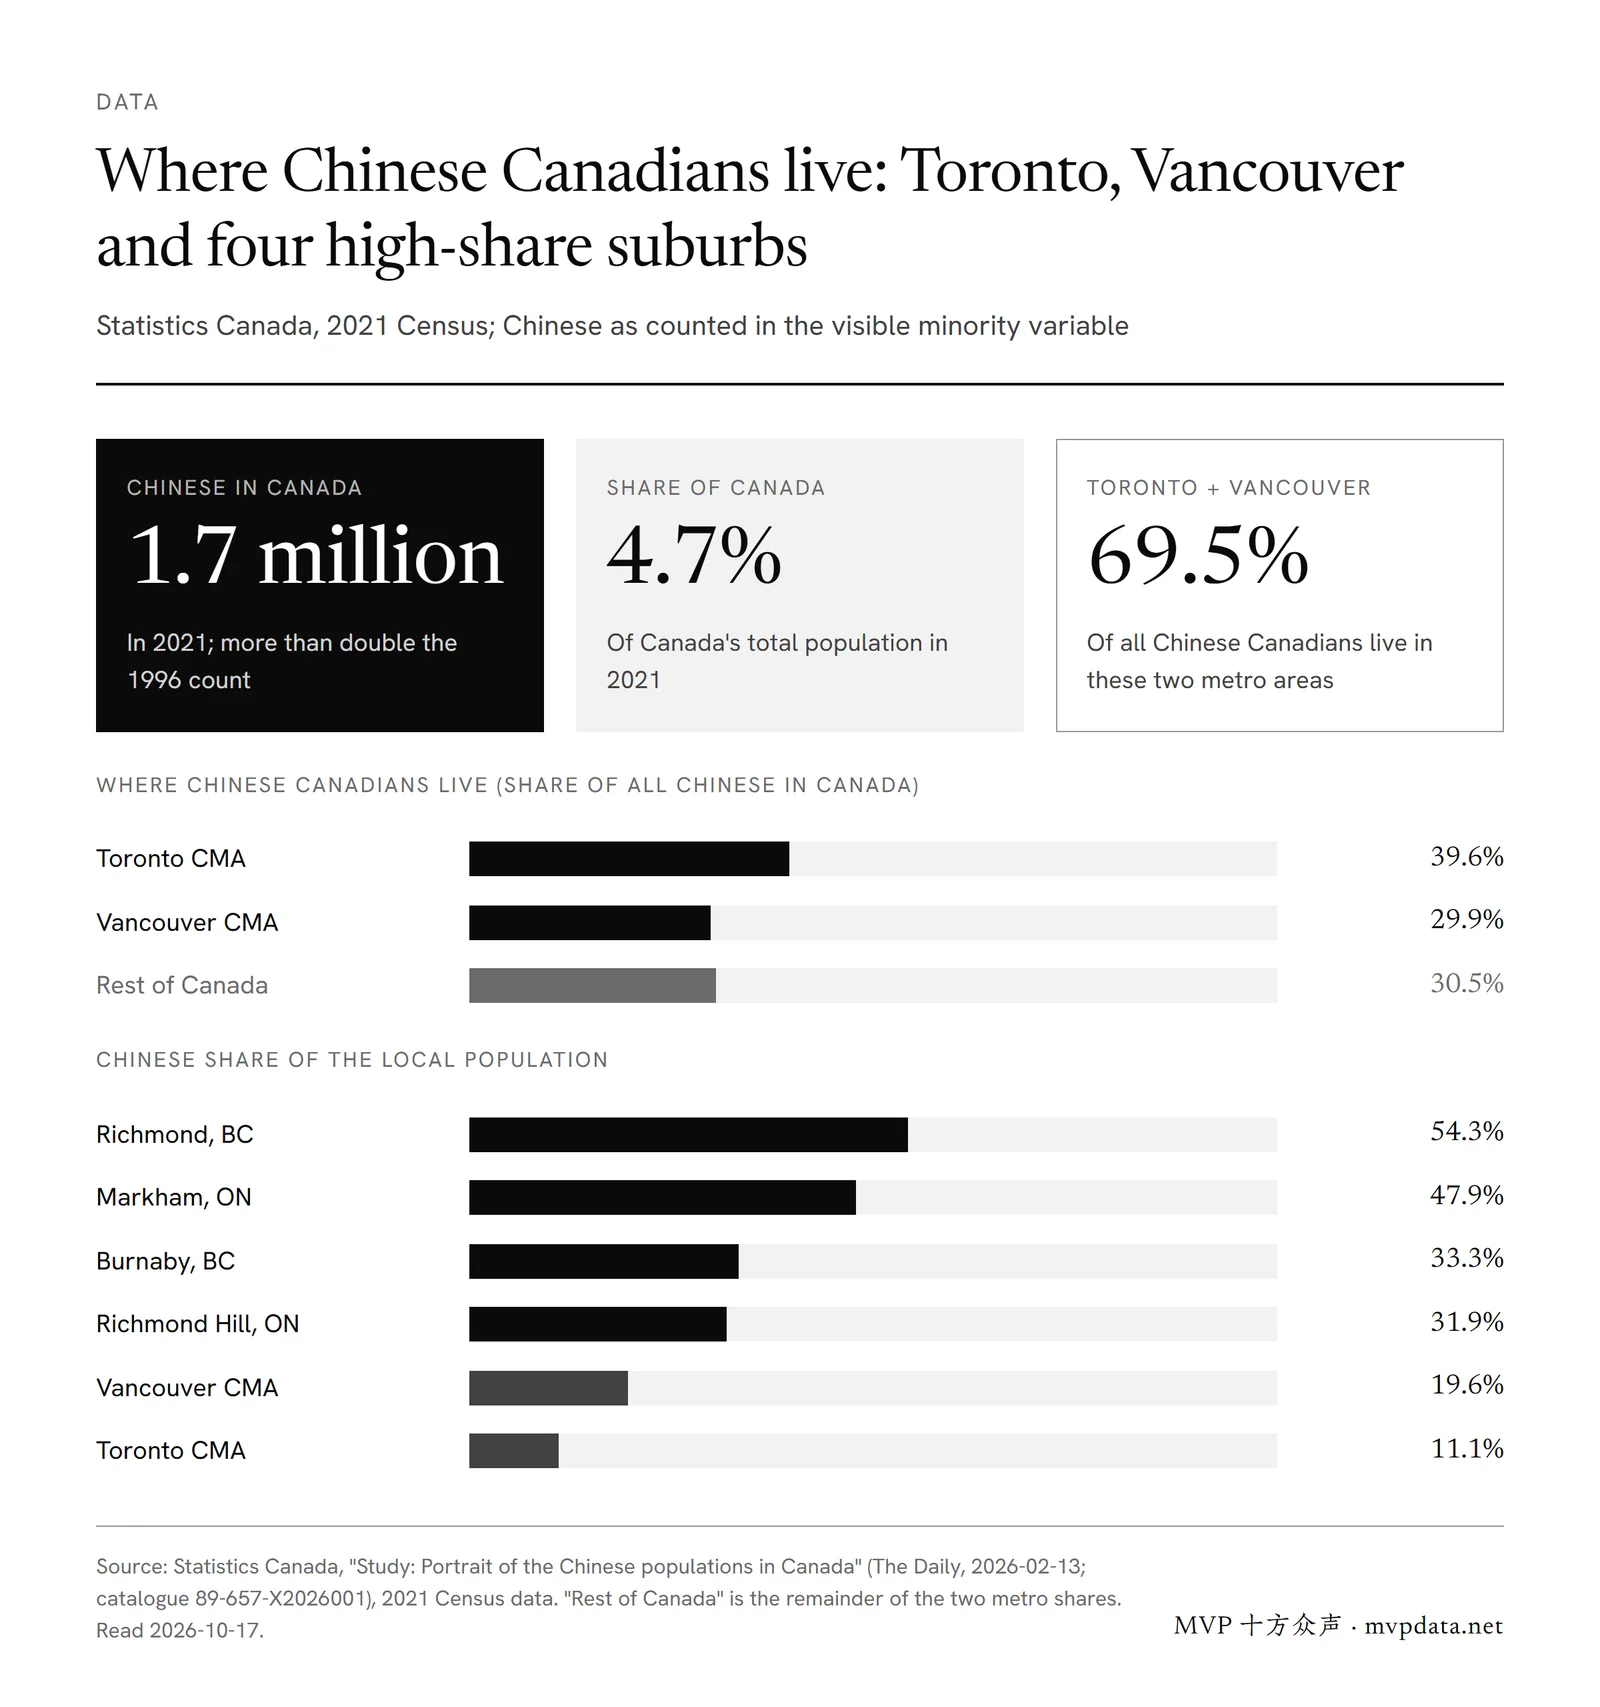
The two metros differ in density. Chinese residents make up 19.6% of the Vancouver CMA and 11.1% of the Toronto CMA.1 At the municipal level, four suburbs stand out:1
| Municipality (metro area) | Chinese share of the population |
|---|---|
| Richmond (Vancouver) | 54.3% |
| Markham (Toronto) | 47.9% |
| Burnaby (Vancouver) | 33.3% |
| Richmond Hill (Toronto) | 31.9% |
| Vancouver CMA overall | 19.6% |
| Toronto CMA overall | 11.1% |
Recent arrivals came mostly from China: of Chinese immigrants who came to Canada from 1998 to 2021, 86.8% were born in China.1 Statistics Canada’s portrait gives local shares for Toronto and Vancouver only.1 For Montréal and Calgary, the language counts in the next section show the size of the Chinese-speaking audience.
How many people speak Mandarin and Cantonese in Canada?
In Canada, 987,300 people can speak Mandarin and 724,925 can speak Cantonese; 1,528,860 can speak at least one Chinese language.5 “Can speak” means able to hold a conversation, and many people speak both, so the two counts overlap.9
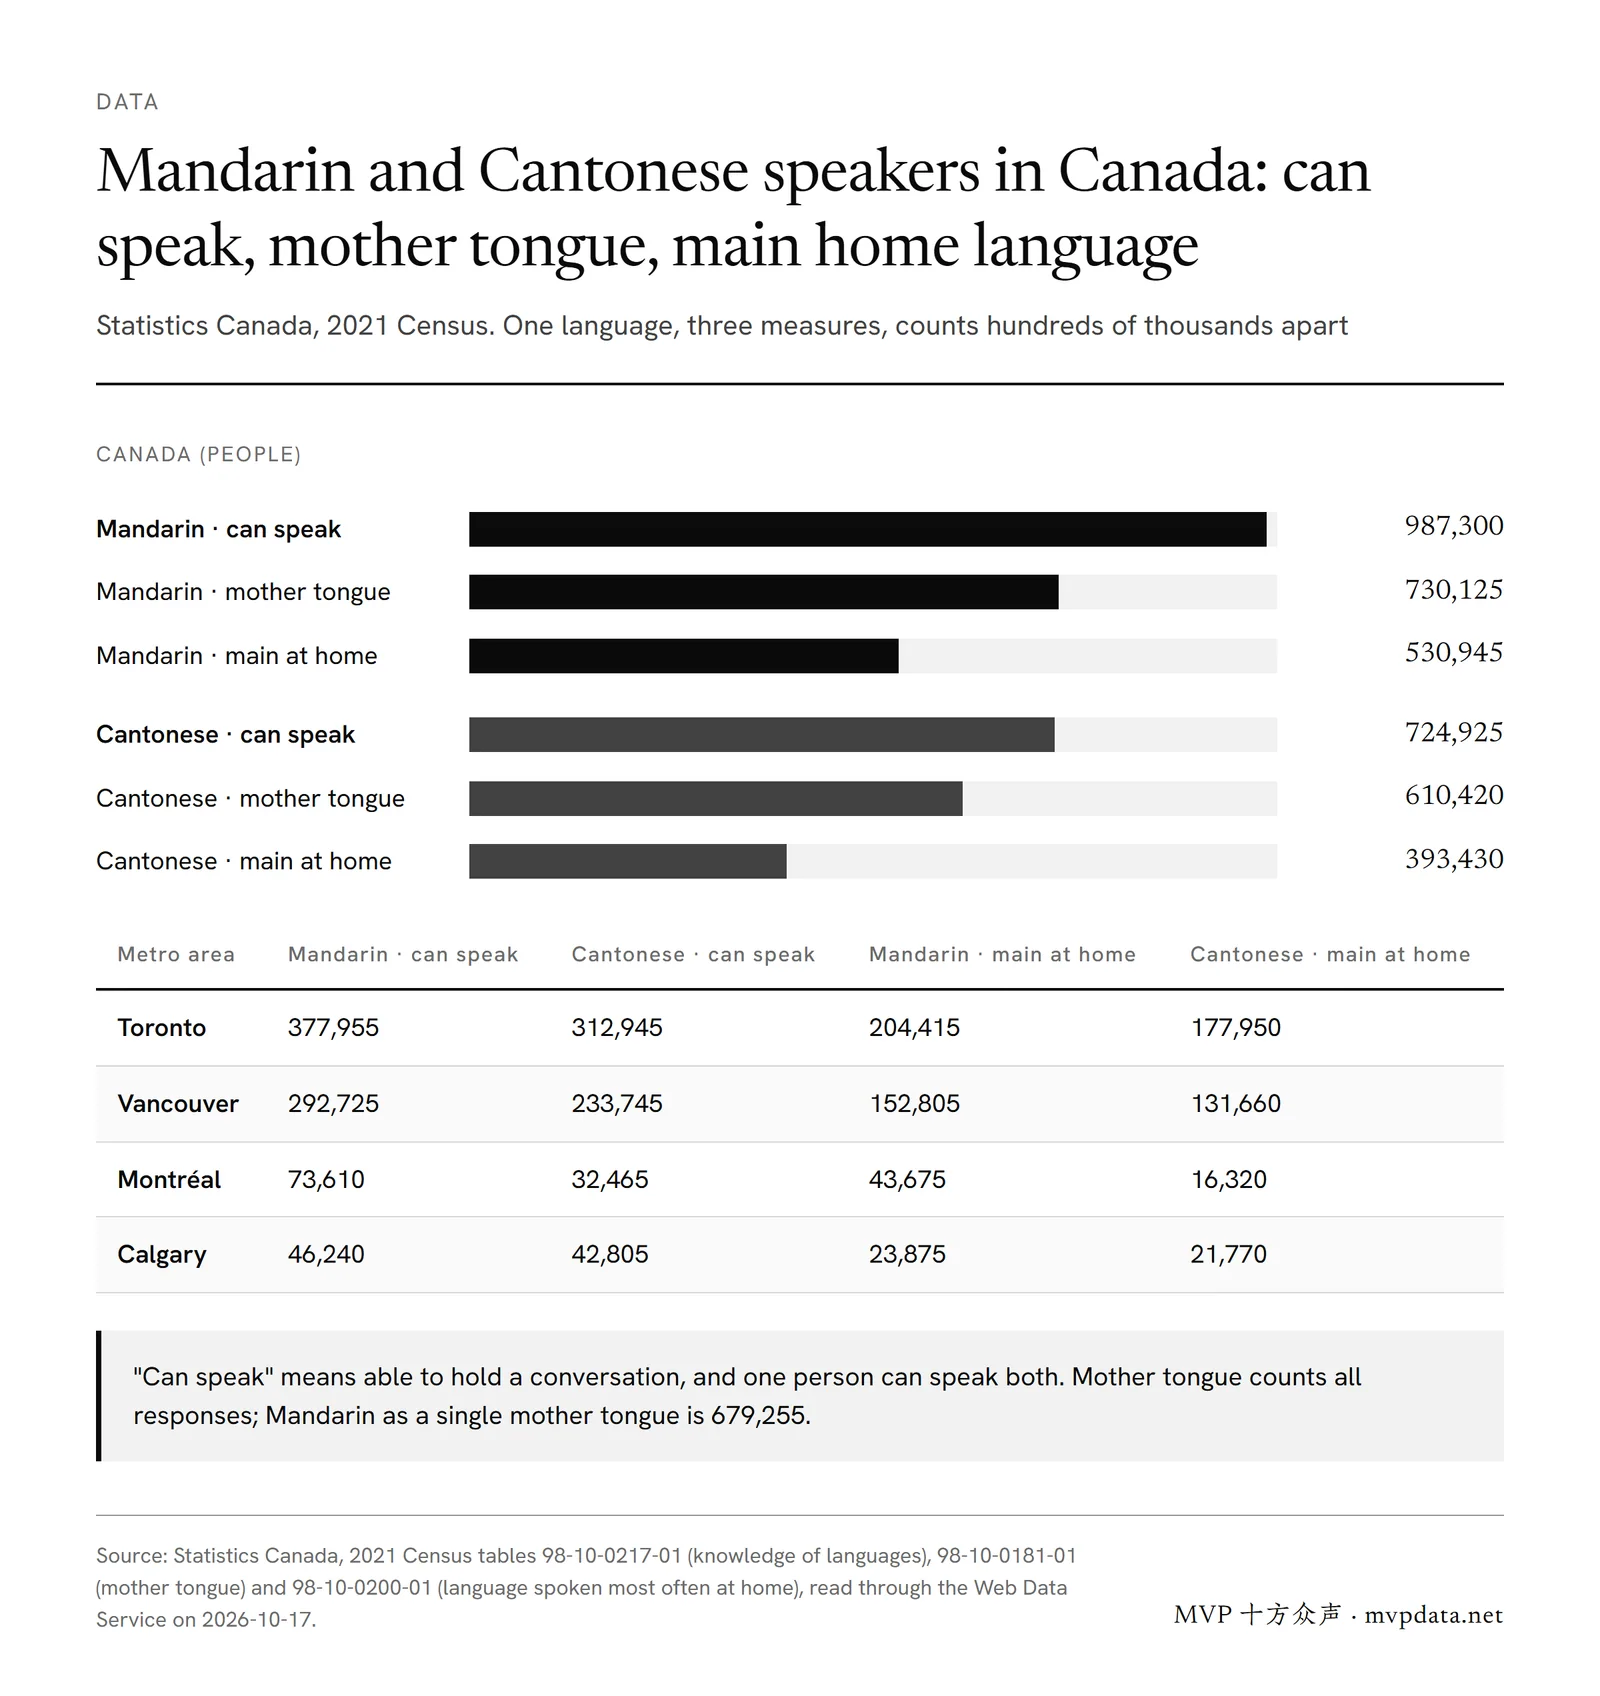
The census measures language three ways, and the counts for the same language differ by hundreds of thousands:
| Measure | Mandarin | Cantonese |
|---|---|---|
| Can speak (knowledge) | 987,300 | 724,925 |
| Mother tongue, all responses | 730,125 | 610,420 |
| Mother tongue, single responses | 679,255 | 553,375 |
| Spoken most often at home | 530,945 | 393,430 |
Knowledge comes from table 98-10-0217-01,5 mother tongue from 98-10-0181-01,8 and home language from 98-10-0200-01.6 Mother tongue is the first language learned at home in childhood and still understood.8
By metro area, Toronto and Vancouver each have more than 200,000 Mandarin speakers and more than 200,000 Cantonese speakers:5,6
| Metro area | Can speak Mandarin | Can speak Cantonese | Mandarin most often at home | Cantonese most often at home |
|---|---|---|---|---|
| Toronto | 377,955 | 312,945 | 204,415 | 177,950 |
| Vancouver | 292,725 | 233,745 | 152,805 | 131,660 |
| Montréal | 73,610 | 32,465 | 43,675 | 16,320 |
| Calgary | 46,240 | 42,805 | 23,875 | 21,770 |
As shares: among people who mainly speak a non-official language at home, 13% speak Mandarin and 11% Cantonese in Toronto, and 21% Mandarin and 18% Cantonese in Vancouver; in Montréal, Mandarin is 8%.10
The two groups also differ in profile. Statistics Canada reports that 85% of Mandarin speakers were born outside Canada, against 76% of Cantonese speakers, and that Mandarin speakers average 39 years of age against 50 for Cantonese speakers.9 Chinese is also a working language: in 2021 about 130,000 workers spoke Mandarin at work and 83,000 spoke Cantonese.9
How many people speak Chinese at home in the US?
In 2024, 3,734,956 people aged 5 and over in the United States spoke Chinese at home, including Mandarin and Cantonese, with a margin of error of ±51,891.7 Of them, 1,839,955 speak English “very well” and 1,895,001 less than “very well”, roughly half each.7
The ACS table groups all Chinese languages into one category, so unlike the Canadian census it does not separate Mandarin from Cantonese.7 By metro area, Chinese speakers cluster on the two coasts:7
| Metro area | Speak Chinese at home (aged 5+) |
|---|---|
| New York–Newark–Jersey City | 721,530 |
| Los Angeles–Long Beach–Anaheim | 494,179 |
| San Francisco–Oakland–Fremont | 394,037 |
| San Jose–Sunnyvale–Santa Clara | 197,182 |
| Seattle–Tacoma–Bellevue | 145,720 |
| Boston–Cambridge–Newton | 141,247 |
New York, Los Angeles and San Francisco together account for about 1.6 million, more than 40% of everyone in the US who speaks Chinese at home.7 Pew Research Center’s count of the Chinese-origin population, on 2023 data, puts the same three metros on top: New York 840,000, Los Angeles 630,000 and San Francisco 550,000.11
Why can’t Chinese-origin and Chinese-speaker counts be added?
Origin counts and language counts describe two groups that largely overlap without being identical, so adding them counts many people twice.
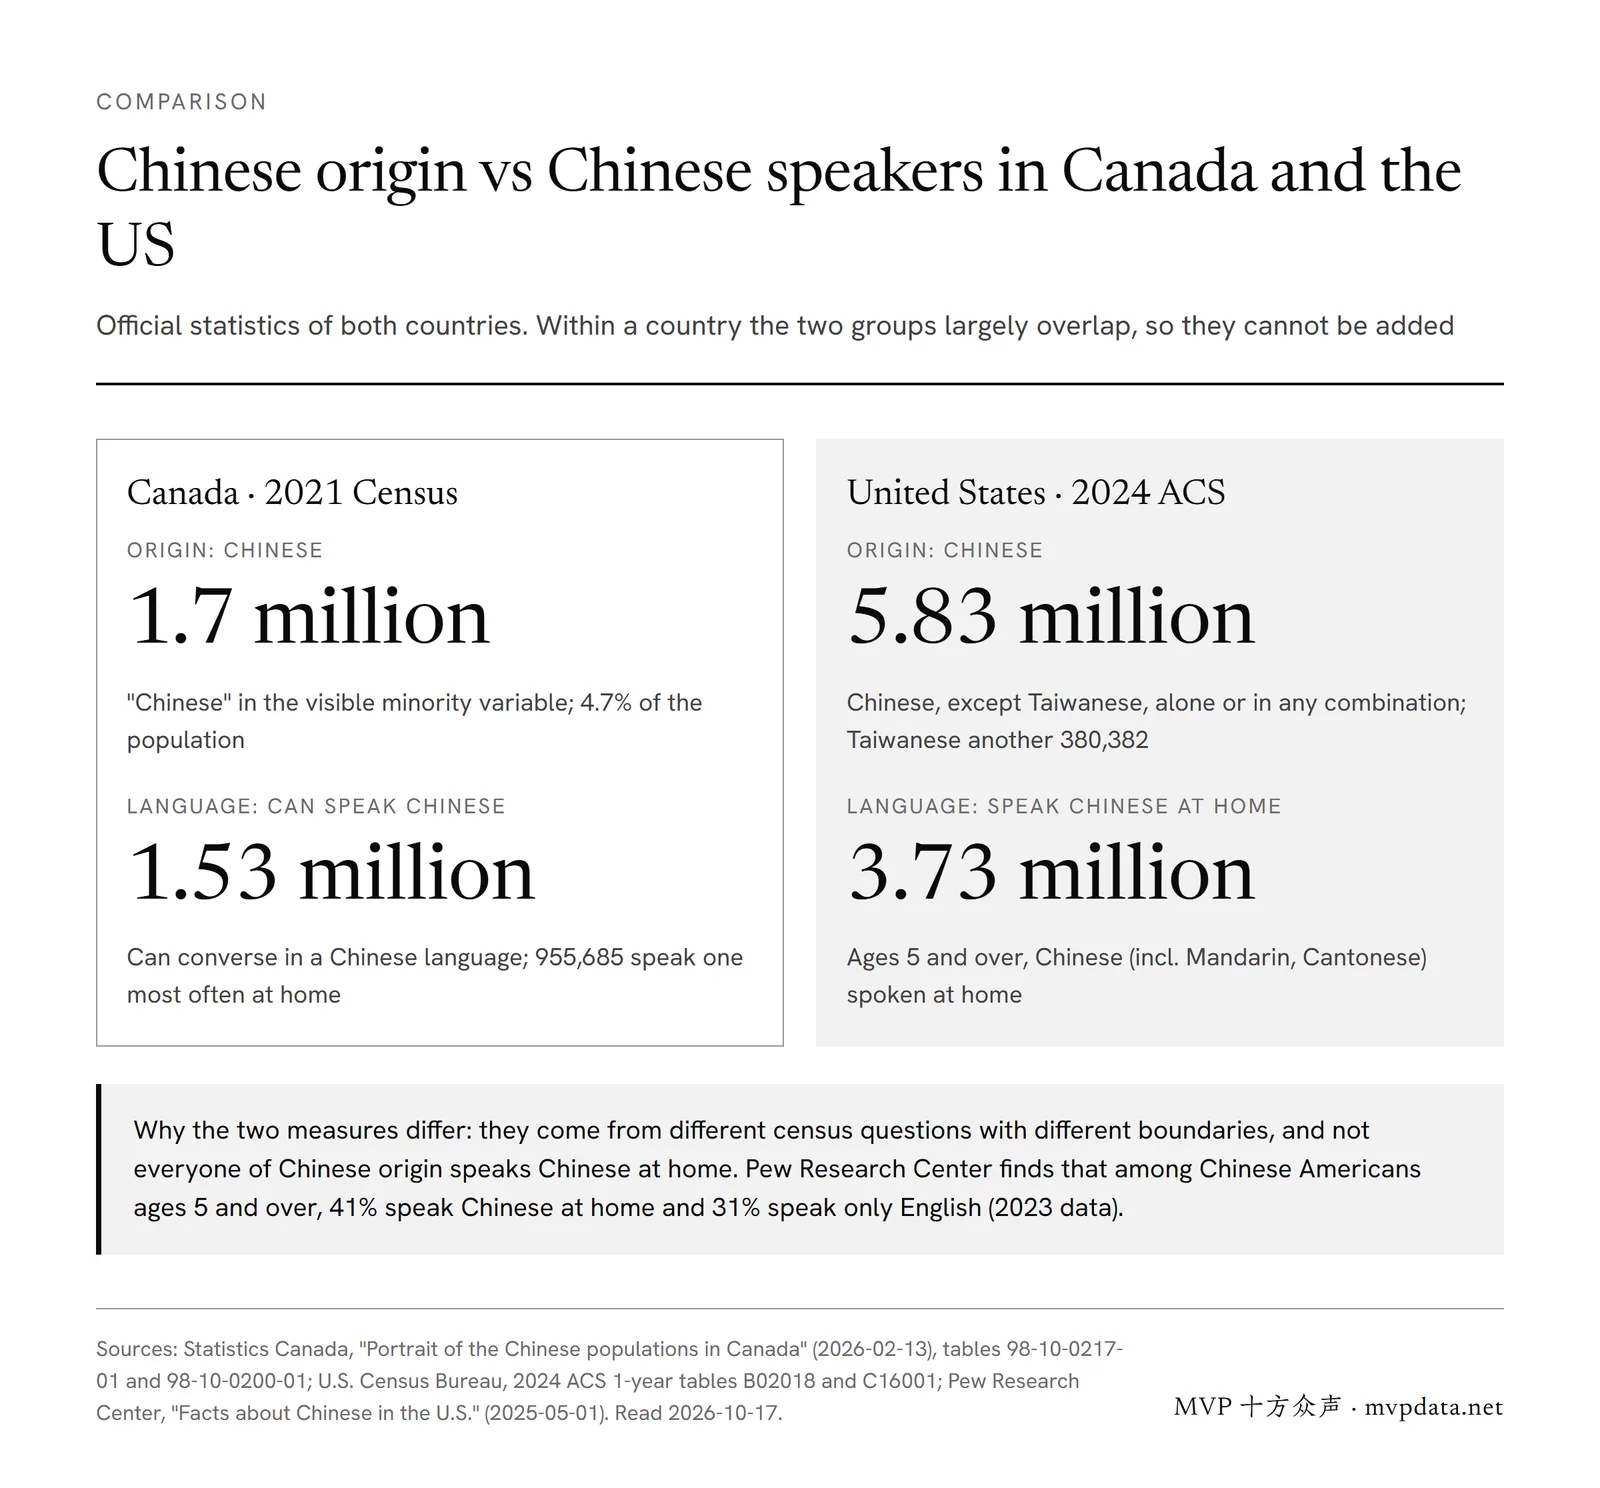
- Not every Chinese American speaks Chinese at home. Among Chinese Americans aged 5 and over, Pew finds 41% speak Chinese at home and 31% speak only English; 64% speak English proficiently.11
- The two numbers come from different census questions. Canada’s Chinese count comes from the visible minority variable,1 while the 1,528,860 Chinese speakers come from the knowledge-of-languages question;5 each has its own boundary. The same holds in the US, where the origin count and the home-language count sit in separate tables.2,7
- The countries define the groups differently. Canada uses the visible minority variable;1 the US uses self-reported detailed Asian groups and lists Taiwanese separately. The US “alone or in any combination” figures tally groups, so a person who reports two Asian groups is counted in both.2
So when someone asks how many Chinese people live in North America, give each country’s origin count with its year: about 1.7 million in Canada and 5.83 million in the US. When the question is how many people Chinese-language content can reach, use the language counts: 1.53 million Chinese speakers in Canada and 3.73 million people speaking Chinese at home in the US.
Numbers that circulate, checked against the source
The figures below are common in search results and AI answers. Each was checked against the original on 2026-10-17.
| What circulates | What the source says |
|---|---|
| “730,000 people speak Mandarin in Canada” | 730,125 is Mandarin as a mother tongue (all responses); 679,255 report Mandarin as their only mother tongue. 987,300 can speak Mandarin, and 530,945 speak it most often at home.8,5,6 |
| “5.5 million Chinese Americans” | That is the 2023 figure.11 The 2024 ACS gives 5,828,538, excluding Taiwanese.2 |
| “3.7 million Chinese Americans” | That is the number of people aged 5+ who speak Chinese at home, a language count: 3,734,956 in 2024.7 |
| “A third of US adults (33%) use TikTok” | That is Pew’s 2023 survey figure.12 Pew’s 2025 report gives 37%.13 |
Which social media platforms do US adults use?
YouTube (84%) and Facebook (71%) reach the most US adults, followed by Instagram (50%) and TikTok (37%).13 The figures come from Pew Research Center’s survey of 5,022 US adults, conducted February 5 to June 18, 2025.13
| Platform | US adults who ever use it (2025) |
|---|---|
| YouTube | 84% |
| 71% | |
| 50% | |
| TikTok | 37% |
| 32% | |
| 26% |
Three breakdowns matter for brands reaching Chinese-speaking audiences:13
- Age: about eight in ten adults aged 18 to 29 use Instagram, against 19% of those 65 and older.
- Race and ethnicity: 58% of Asian adults use Instagram, against 45% of White adults.
- Frequency: about half of adults visit Facebook and YouTube at least once a day; 24% use TikTok daily. These figures come from a separate Pew survey of 5,123 US adults, February 24 to March 2, 2025.
The survey covers US adults only, and the report does not mention WeChat, RedNote (Xiaohongshu) or Douyin.13 This article found no official statistics on North American use of those Chinese apps, so it gives no figures for them.
What do these numbers mean for brands working with Chinese-speaking creators?
The numbers answer three planning questions: which cities to focus on, which language to use, and which platforms to run on.
- Cities: in Canada the audience is concentrated in Toronto and Vancouver, which together hold nearly 70% of Chinese Canadians;1 in the US it is concentrated in New York, Los Angeles and the San Francisco Bay Area.7 Events, retail and local partnerships start in these metros.
- Language: in Canada, more people speak Mandarin than Cantonese, and Mandarin speakers are 11 years younger on average;9 in Vancouver, Cantonese as a main home language is close behind Mandarin (18% against 21%).10 Mandarin content reaches the larger, younger group; Cantonese still matters for older households in Vancouver and Toronto. In the US, half of Chinese speakers also speak English very well,7 so bilingual content reaches both groups at once.
- Platforms: YouTube and Facebook reach most US adults, while Instagram reaches about eight in ten adults under 30 and an above-average share of Asian adults.13 Choose creators by the platform your target age group uses.
- Sizing: estimate reach with the language counts, and never add the origin and language counts together.
Canada’s 2026 Census will publish new language and ethnocultural data in September and October 2027,4 and this article will be updated with them.
How MVP works with Chinese-speaking audiences from Toronto
MVP (Mega Volume Production, 十方众声) is headquartered in Toronto and contracts through 北京十方众声传媒有限公司 in mainland China and Mega Volume Production Inc. in Canada, working in talent management and cross-border brand marketing. Since 2023, MVP has run cross-border influencer marketing in North America, connecting Chinese brands with Chinese-speaking creators who live in North America and present products on TikTok, Instagram and YouTube in Chinese, English or both; see cross-border influencer marketing.
- Creators and paid media together: for ads on overseas platforms, mainly in North America, see social media advertising for global brands. Ad accounts are opened in MVP’s name and ad spend is settled by MVP.
- Metrics in the contract: reach and other metrics are agreed in the proposal, written into the contract and checked against evidence such as platform dashboard reports.
- Working languages: Chinese and English.
Chinese-speaking creators in North America who want to work with MVP can start at influencers. Brand work is quoted to the brief; send your request to start.
Notes
- Study: Portrait of the Chinese populations in Canada
- Asian Alone or in Any Combination by Selected Groups
- Asian American and Pacific Islander Heritage Month: May 2026
- 2026 Census of Population: Key content release schedule
- Knowledge of languages by age and gender: Canada, provinces and territories, census metropolitan areas and census agglomerations with parts
- Language spoken most often at home by other language(s) spoken regularly at home: Canada, provinces and territories, census metropolitan areas and census agglomerations with parts
- Language Spoken at Home for the Population 5 Years and Over
- Mother tongue by single and multiple mother tongue responses: Canada, provinces and territories, census metropolitan areas and census agglomerations with parts
- Asian History Month: Let’s talk languages
- Mandarin is the main non-official language spoken predominantly at home in Toronto and Vancouver, while in Montréal, it is Spanish and Arabic
- Facts about Chinese in the U.S.
- Americans’ Social Media Use
- Americans’ Social Media Use 2025
Questions
What percentage of Toronto is Chinese?
Chinese residents were 11.1% of the Toronto metro area’s population at the 2021 Census. The share is much higher in some suburbs: 47.9% in Markham and 31.9% in Richmond Hill.1 The Toronto metro area is home to 39.6% of all Chinese Canadians.
Which US cities have the most Chinese Americans?
Are Taiwanese Americans counted as Chinese in the US Census?
When will Canada publish new data on Chinese Canadians?
Results of the 2026 Census come out in stages: language data on September 8, 2027, and ethnocultural and religious diversity data on October 27, 2027.4 Until then the 2021 Census remains the official count.